Analyze Stack Traces in Android Studio
Introduction
As programmers, we spend a significant part of our time debugging errors. Stack traces are very useful in doing so, and careful analysis of the stack traces help us to locate and fix the problem. In this post, I’ll show a quick way we can use Android Studio to make it easier to debug errors using the built-in “stack trace analysis” tool.
Context
As Android developers, once an app is released into the wild (i.e deployed on a device outside our development environment), we have to rely on crash reporting tools like Firebase Crash reporting, Instabug, Appsee, etc, to collect these reports and aggregate them for us.
The experience of working with stack traces varies from whether we are in development or in production. In development, we often get the stack traces right there in the logcat of Android Studio where each line in the stack trace is a clickable link that takes us straight to corresponding line of code.
On the other hand, when we collect crash reports and stack traces in the wild, we collect them as text - sometimes formatted, sometimes not. This adds the additional overhead of having to format the stack trace in order to be human-readable and then manually search for the corresponding lines of code in the IDE.
Using the “Anaylze Stack Trace” tool
Luckily for us, Android Studio solves a part of this problem and makes it easier for us when we are analyzing stack traces that are generated in the wild.
When you receive a stack trace, you can import them into Android Studio and introduce all the nice formatting, hyperlink and navigating functionality that we get as if it’s a crash from the logcat.
The Android Developer docs page pretty much explains how to use this tool, but I’ll summarize the steps here:
- In the Android Studio menu bar, navigate to
"Analyze > Analyze Stack Trace or Thread Dump" - Paste the stack trace in the window
- Click
"Normalize"to format the stack trace - in case it is not already formatted. - Click on
"OK"to complete this.
On clicking “OK”, a tab is opened in the “Run” window of the screen, and there, you have the well formatted, hyperlinked stack trace, ready to be navigated by clicking through.
It’s really interesting to note that once you have the stack trace in your clipboard, the tool automatically pre-fills the field and saves you the stress of having to paste it manually. Pretty cool.
Analyzing obfuscated stack trace
Sometimes, if your app is a release build, then chances are that your stack traces are obfuscated
and shrunk using Proguard or R8/D8.
Depending on the reporting tool you are using, some require you to upload your mapping.txt
file, and help you to de-obfuscate these stack traces, so you may never need to do this yourself.
However, for various reasons, this may not be the case, and you may end up with obfuscated stack traces and it becomes difficult to debug.
In such cases, you need to install a Proguard unscrambler in Android Studio.
I found that there are some unscramblers available in the IntelliJ plugin marketplace. I personally found this one useful. (Disclaimer: I’m not in any way related to the project or the author, and while I can’t vouch for the security or safety of the plugin, it worked for me and the source is available here). You can check out this resource here for how to install a plugin: https://www.jetbrains.com/help/idea/managing-plugins.html
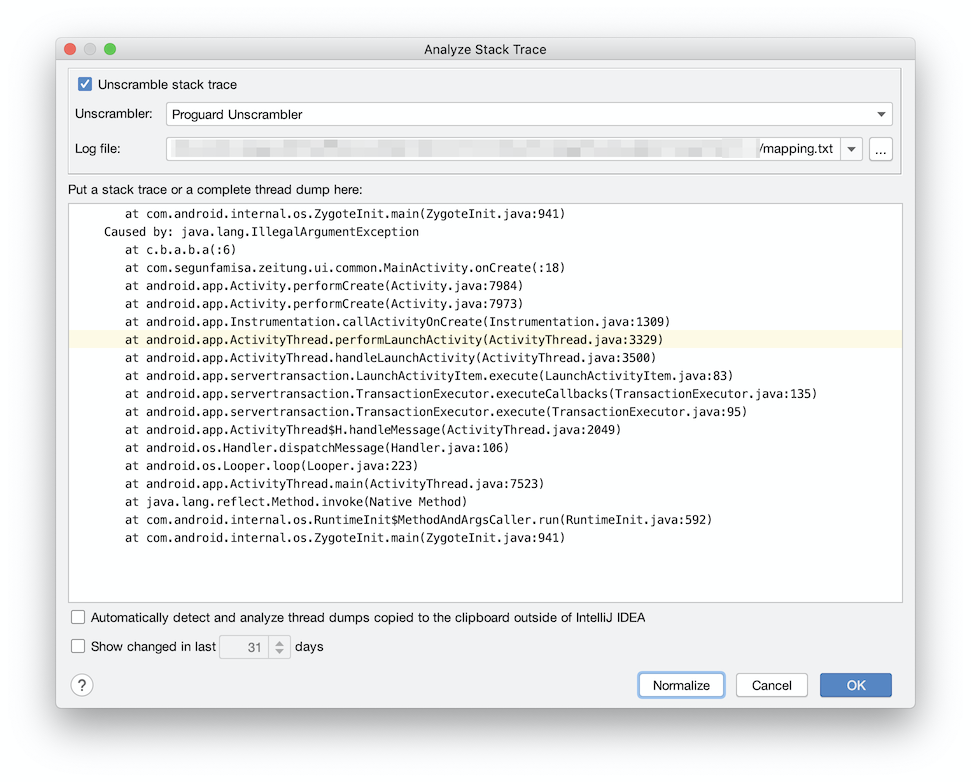
If you have no unscrambler, the checkbox to unscramble stack traces in the Analyze Stack Trace
window is disabled. If you have an unscrambler installed, it appears as in the image below, and you
are able to check the box and fill in the details.
When you click “OK”, the unscrambler kicks into action, and you have your de-obfuscated stack trace
in the
Extras
- Even though the article says Proguard, it seems to work as well for code obfuscated & packaged by R8/D8 since the underlying tools have been updated to work with them.
- Just an FYI, there is a Proguard retrace tool
bundled with the Android SDK at
<Android SDK directory>/tools/proguard/bin/retrace.sh, and this allows you to deobfuscate (or retrace) the stack trace by using the command line, like:
# <path to retrace.sh> <path to mapping.txt> <path to stacktrace text file>
$ANDROID_HOME/tools/proguard/bin/retrace.sh mapping.txt stacktrace.txt
- Proguard (via Guardsquare) also have the retrace tool distributed as a dependency in Maven repository and you can use this, if you want to do it programmatically in your own tool, feel free to dive in. (hint, that’s what the unscramblers use under the hood).
I hope you have learnt something interesting in this post.
If you have ideas, correction or feedback about this post, feel free to drop them in the comments.
Cheers.